If you would like to monitor the traffic between two network devices or network segments, you will need to obtain access to the packet flow between the two hosts or network segments. In a virtual lab environment we have a number of options, and normally the opportunity to reconfigure things to get access.
In a production or more a physical environment, we may need to insert a network tap (however this would require disconnection of the link to connect the tap, and also an expensive tap) or configure the production switch to mirror traffic to an available socket on the switch.
Alternatively it is possible to configure a spare low cost switch such as the Netgear ProSAFE GS105E v2 to mirror a port, and then insert it like a tap. This process is also similar to what you would need to complete on a production switch.
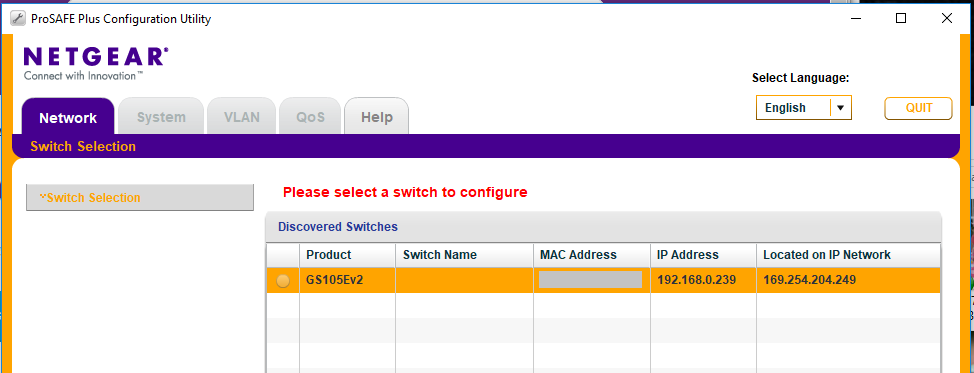
First find the IP address of the switch. If you use a new ProSAFE GS105E, you may need to use the utility on a new switch, or configure your machine to access the default subnet 192.168.0.0/24 and connect to http://192.168.0.239 (the default ‘off network’ address of this switch).
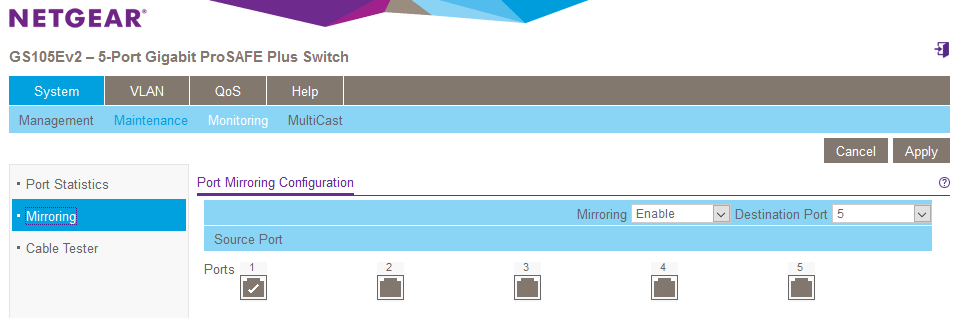
Next, navigate to the “System” > “Monitoring” > “Mirroring”. Here we can define a ‘source port’ (1) where we want to monitor all traffic, next we select a destination port (5) that all traffic on source port (1) will be mirrored to. On the Netgear we also need to change the ‘Mirroring’ drop down to ‘enabled’.
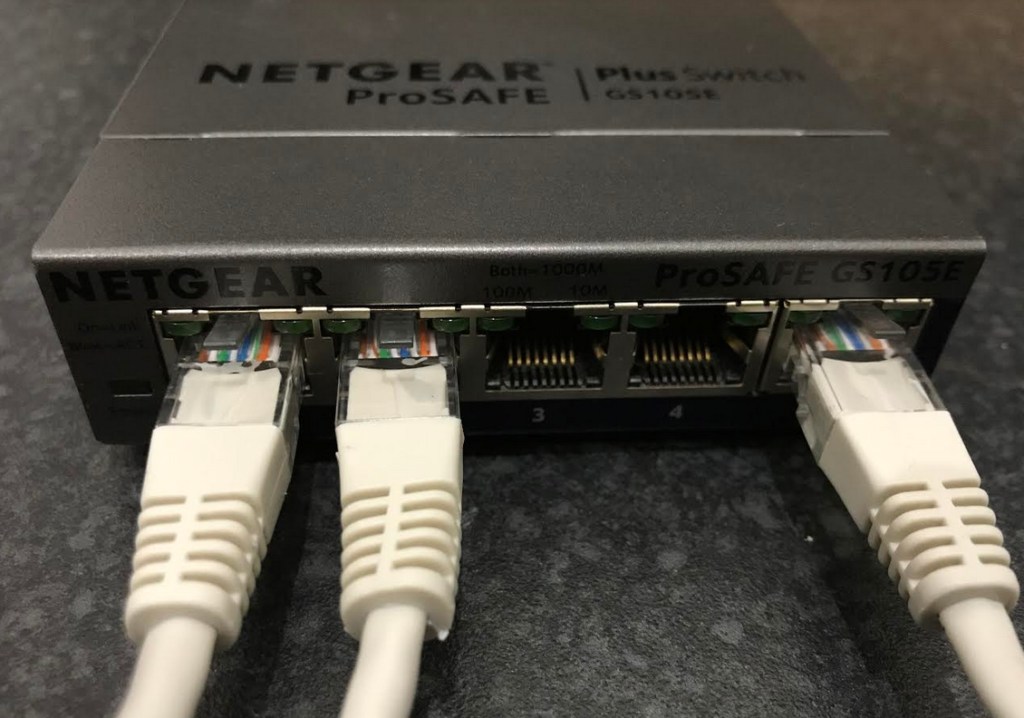
If this was a production switch, we would be monitoring an already active port and using a spare (5) as the mirror for monitoring, in this case, I will connect ports 1 and 2 to a test network and an internet of things (IoT) device bridge that we are interested in monitoring. I will then connect my laptops network interface to port 5, the mirrored interface. (Remember, you are not connecting to the network here, you are monitoring a copy of the traffic flowing through port 1.
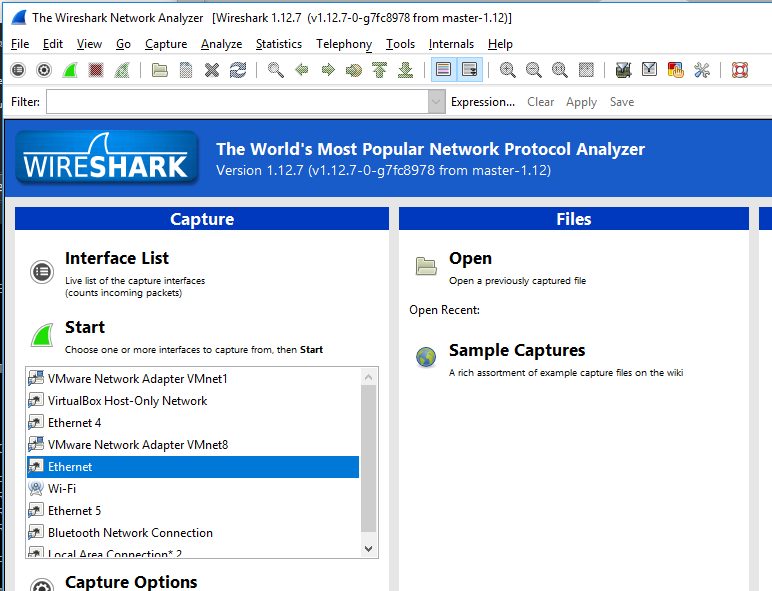
We therefore fire up Wireshark, selecting the correct physical interface that connects into port 5, and then monitor the network link with the promiscuous option selected.
Wireshark should show you the packets passing through port1, in this test environment you can see source address x.x.79.35 with packets heading to 192.168.3.10, and also 192.168.3.10 sending packets to x.x.79.35.
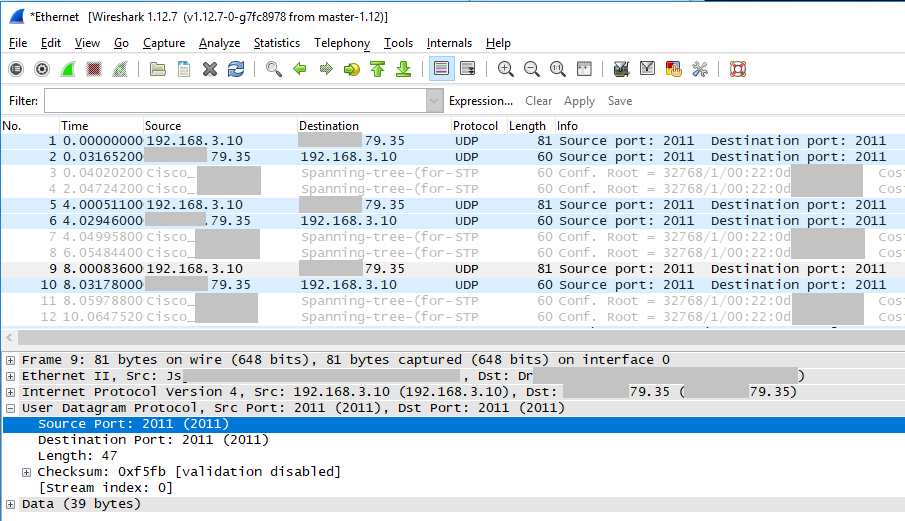
We can now happily inspect the traffic between this device and the network, we can see traffic flowing in both directions and at a high level see the two main IP addresses of interest, along with a data flow on UDP/2011 that can be further inspected.
Enjoy.